mettoolbox.pet.hamon
- mettoolbox.pet.hamon(lat, source_units, temp_mean_col=None, temp_min_col=None, temp_max_col=None, start_date=None, end_date=None, dropna='no', clean=False, round_index=None, skiprows=None, names=None, target_units=None, print_input=False)
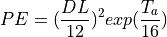
Hamon PET: f(Tavg, latitude)
Average daily temperature can be supplied or if not, calculated by (Tmax+Tmin)/2.
- Parameters:
lat (
float) – The latitude of the station. Positive specifies the Northern Hemisphere, and negative values represent the Southern Hemisphere.temp_min_col (str, int) – The column name or number (data columns start numbering at 1) in the input data that represents the daily minimum temperature.
temp_max_col (str, int) – The column name or number (data columns start numbering at 1) in the input data that represents the daily maximum temperature.
k (float) – A scaling factor, defaults to 1. This is an adjustment for local conditions, for example, Lu, 2005 found that k=1.2 was a better fit for the southeastern United States.
source_units (
str|list|None) –If unit is specified for the column as the second field of a ‘:’ delimited column name, then the specified units and the ‘source_units’ must match exactly.
Any unit string compatible with the ‘pint’ library can be used.
Since there are two required input columns (“temp_min_col” and “temp_max_col”) and one optional input column (“temp_mean_col”) you need to supply units for each input column in source_units.
Command line:
mettoolbox pet hamon 24 1 2 degF,degF < tmin_tmax_data.csv
Python:
from mettoolbox import mettoolbox as mt
df = mt.pet.hamon(24,
                  1,
                  2,
                  ["degF", "degF"],
                  input_ts="tmin_tmax_data.csv")
start_date (str) –
[optional, defaults to first date in time-series, input filter]
The start_date of the series in ISOdatetime format, or ‘None’ for beginning.
end_date (str) –
[optional, defaults to last date in time-series, input filter]
The end_date of the series in ISOdatetime format, or ‘None’ for end.
dropna (str) –
[optional, defauls it ‘no’, input filter]
Set dropna to ‘any’ to have records dropped that have NA value in any column, or ‘all’ to have records dropped that have NA in all columns. Set to ‘no’ to not drop any records. The default is ‘no’.
clean –
[optional, default is False, input filter]
The ‘clean’ command will repair a input index, removing duplicate index values and sorting.
round_index –
[optional, default is None which will do nothing to the index, output format]
Round the index to the nearest time point. Can significantly improve the performance since can cut down on memory and processing requirements, however be cautious about rounding to a very course interval from a small one. This could lead to duplicate values in the index.
skiprows (list-like or integer or callable) –
[optional, default is None which will infer header from first line, input filter]
Line numbers to skip (0-indexed) if a list or number of lines to skip at the start of the file if an integer.
If used in Python can be a callable, the callable function will be evaluated against the row indices, returning True if the row should be skipped and False otherwise. An example of a valid callable argument would be
lambda x: x in [0, 2].index_type (str) –
[optional, default is ‘datetime’, output format]
Can be either ‘number’ or ‘datetime’. Use ‘number’ with index values that are Julian dates, or other epoch reference.
names (str) –
[optional, default is None, transformation]
If None, the column names are taken from the first row after ‘skiprows’ from the input dataset.
MUST include a name for all columns in the input dataset, including the index column.
target_units (str) –
[optional, default is None, transformation]
The purpose of this option is to specify target units for unit conversion. The source units are specified in the header line of the input or using the ‘source_units’ keyword.
The units of the input time-series or values are specified as the second field of a ‘:’ delimited name in the header line of the input or in the ‘source_units’ keyword.
Any unit string compatible with the ‘pint’ library can be used.
This option will also add the ‘target_units’ string to the column names.
print_input –
[optional, default is False, output format]
If set to ‘True’ will include the input columns in the output table.
tablefmt (str) –
[optional, default is ‘csv’, output format]
The table format. Can be one of ‘csv’, ‘tsv’, ‘plain’, ‘simple’, ‘grid’, ‘pipe’, ‘orgtbl’, ‘rst’, ‘mediawiki’, ‘latex’, ‘latex_raw’ and ‘latex_booktabs’.
temp_mean_col (str, int) – The column name or number (data columns start numbering at 1) in the input data that represents the daily mean temperature. If None will be estimated by the average of temp_min_col and temp_max_col.
- Return type:
pandas.Series containing the calculated evaporation.
Examples
>>> et_hamon = hamon(tmean, lat)
Notes
Following [hamon_1961], [oudin_2005], and [lu_2005].
References
[hamon_1961]Hamon, W. R. (1963). Estimating potential evapotranspiration. Transactions of the American Society of Civil Engineers, 128(1), 324-338.
[oudin_2005]Oudin, L., Hervieu, F., Michel, C., Perrin, C., Andréassian, V., Anctil, F., & Loumagne, C. (2005). Which potential evapotranspiration input for a lumped rainfall–runoff model?: Part 2—Towards a simple and efficient potential evapotranspiration model for rainfall–runoff modelling. Journal of hydrology, 303(1-4), 290-306.
[lu_2005]Lu et al. (2005). A comparison of six potential evapotranspiration methods for regional use in the southeastern United States. Journal of the American Water Resources Association, 41, 621- 633.