Examples
nwis
Additional Options for NWIS: http://waterservices.usgs.gov/rest/DV-Service.html http://waterservices.usgs.gov/rest/IV-Service.html
EXAMPLE: Retrieval of NWIS daily and instantaneous values
The command:
tsgettoolbox nwis_dv --sites=02232000 --startDT 2008-01-01 --endDT 2008-01-10
Would display:
Datetime,USGS-02232000-00060,USGS-02232000-00065,USGS-02232000-63160
2008-01-01,69,2.71,
2008-01-02,70,2.73,
2008-01-03,68,2.73,
2008-01-04,130,2.67,
2008-01-05,110,2.68,
2008-01-06,102,2.68,
2008-01-07,102,2.68,
2008-01-08,91,2.69,
2008-01-09,82,2.68,
2008-01-10,75,2.68,
Note the difference in the –endDT option compared to the example above.
To pull from the instantaneous database use the sub-command ‘nwis_iv’. In the following example, the timezone is indicated in the ISO 8601 date/time value as ‘-05:00’.:
tsgettoolbox nwis_iv --sites=02232000 --startDT 2008-01-01 --endDT 2008-01-01T03:00 --database=iv

Datetime,USGS-02232000-00060,USGS-02232000-00065,USGS-02232000-63160
2008-01-01 00:00:00-05:00,109,2.7,
2008-01-01 00:30:00-05:00,100,2.7,
2008-01-01 01:00:00-05:00,100,2.7,
2008-01-01 01:30:00-05:00,58,2.7,
2008-01-01 02:00:00-05:00,75,2.71,
2008-01-01 02:30:00-05:00,58,2.7,
2008-01-01 03:00:00-05:00,84,2.7,
coops
EXAMPLE: Retrieval of CO-OPS data
Center for Operational Oceanographic Products and Services (CO-OPS) Documentation about parameters is available from http://tidesandcurrents.noaa.gov/api/ and ‘tsgettoolbox coops –help’. Timezone is UTC.:
tsgettoolbox coops 8720219 --begin_date 20150101 --end_date 20150102

Datetime,NOS-8720219-water_level-m,NOS-8720219-sigma,NOS-8720219-o,NOS-8720219-f,NOS-
8720219-r,NOS-8720219-l,NOS-8720219-quality
2015-01-01 00:00:00,0.397,0.01,0,0,0,0,v
2015-01-01 00:06:00,0.386,0.003,0,0,0,0,v
2015-01-01 00:12:00,0.373,0.003,0,0,0,0,v
2015-01-01 00:18:00,0.366,0.003,0,0,0,0,v
2015-01-01 00:24:00,0.347,0.001,0,0,0,0,v
...
daymet
EXAMPLE: Retrieval of Daymet data
Daymet - Daily meteorology
Documentation about parameters is available from http://daymet.ornl.gov/web_services.html and from ‘tsgettoolbox daymet –help’. Daymet uses a strange 365 day calendar. All leap year, December 31st dates are dropped.:
tsgettoolbox daymet 29.652 -82.325 --year 1980

Datetime,Daymet-tmax_(deg_c),Daymet-tmin_(deg_c),Daymet-dayl_(s),Daymet-prcp_(mm/day),Daymet-srad_(W/m^2),Daymet-swe_(kg/m^2),Daymet-vp_(Pa)
1980-01-01,14,3.5,36634,0,259.2,0,800
1980-01-02,16,-0.5,36634,0,339.2,0,600
1980-01-03,18.5,-1,36634,0,361.6,0,560
1980-01-04,18,3.5,36634,20,236.8,0,800
1980-01-05,15.5,4,36634,0,278.4,0,800
1980-01-06,12,-1.5,36634,0,313.6,0,560
1980-01-07,17.5,-1.5,36634,0,361.6,0,560
...
ldas
To draw time series from the NLDAS (National Land Data Assimilation Service), and GLDAS (Global Land Data Assimilation Service) datasets use the ‘ldas’ subcommand.
NLDAS and GLDAS are part of the LDAS program and that is the name that I put both datasets under…:
tsgettoolbox ldas --help
NLDAS is an hourly dataset from 1979-01-01 on a 0.125x0.125 degree grid (approximately 12x12 km). GLDAS is a 3-hourly dataset from 1979-01-01 on a 0.25x0.25 degree grid (approximately 24x24 km). The size of these dataset can be very large. The timezone is UTC - you will have to make your own correction to EST. Detailed documentation is at http://disc.sci.gsfc.nasa.gov/hydrology/data-rods-time-series-data
Using with ‘tstoolbox’
EXAMPLE: Using ‘tstoolbox convert …’
For NLDAS you have to get a variable at a time, and I am going to save to a file since I want to do some aggregations. Before saving to a file I want to convert to Celsius from Kelvin and can use ‘tstoolbox convert …’ for that. The ‘startDate’ and ‘endDate’ options require the ‘T’ followed by the hour.:
tsgettoolbox ldas --lat 29.652 --lon -82.325 \
                  --variable NLDAS:NLDAS_FORA0125_H.002:TMP2m \
                  --startDate 1980-01-01T00 \
                  --endDate 1981-01-01T00 \
    | tstoolbox convert --offset -273.15 \
    > gainesville_hourly_temperature_c.csv
I didn’t convert to EST, so the following daily aggregations won’t be quite right.
EXAMPLE: Aggregate hourly to daily minimum.
Minimum daily…:
tstoolbox aggregate --agg_interval D \
                    --statistic min \
    < gainesville_hourly_temperature_c.csv \
    > gainesville_daily_temp_min_c.csv
EXAMPLE: Aggregate hourly to daily maximum.
Maximum daily…:
tstoolbox aggregate --agg_interval D \
                    --statistic max \
    < gainesville_hourly_temperature_c.csv \
    > gainesville_daily_temp_max_c.csv
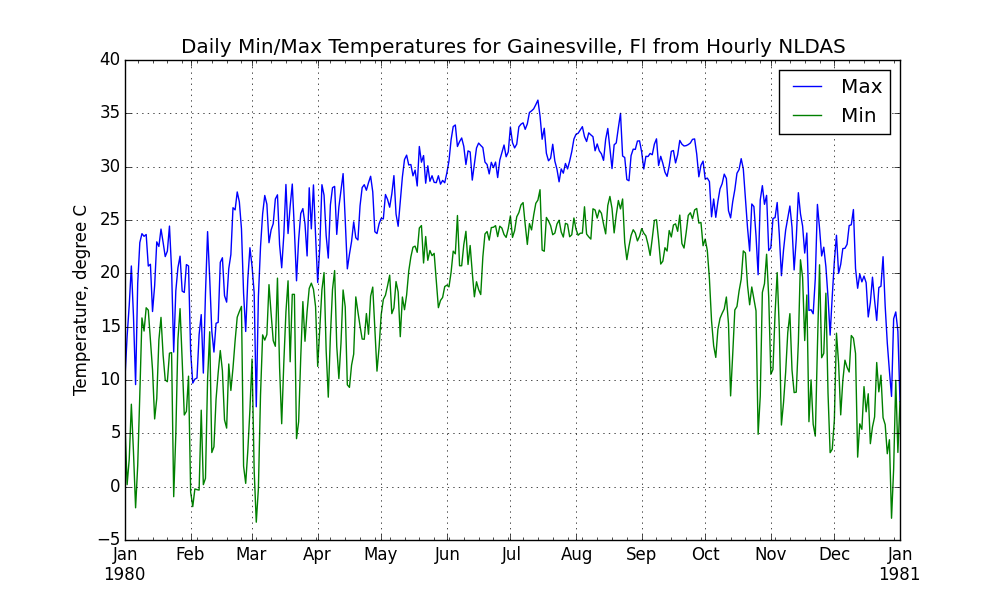
EXAMPLE: Read in multiple files and plot
Read in the two data files and plot results…:
tstoolbox read gainesville_daily_temp_max_c.csv,gainesville_daily_temp_min_c.csv \
    | tstoolbox plot \
        --title 'Daily Min/Max Temperatures for Gainesville, Fl from Hourly NLDAS' \
        --xtitle ' ' \
        --ytitle 'Temperature, degree C' \
        --legend_names 'Max,Min' \
        --ofilename gainesville_min_max_temperatures_nldas.png
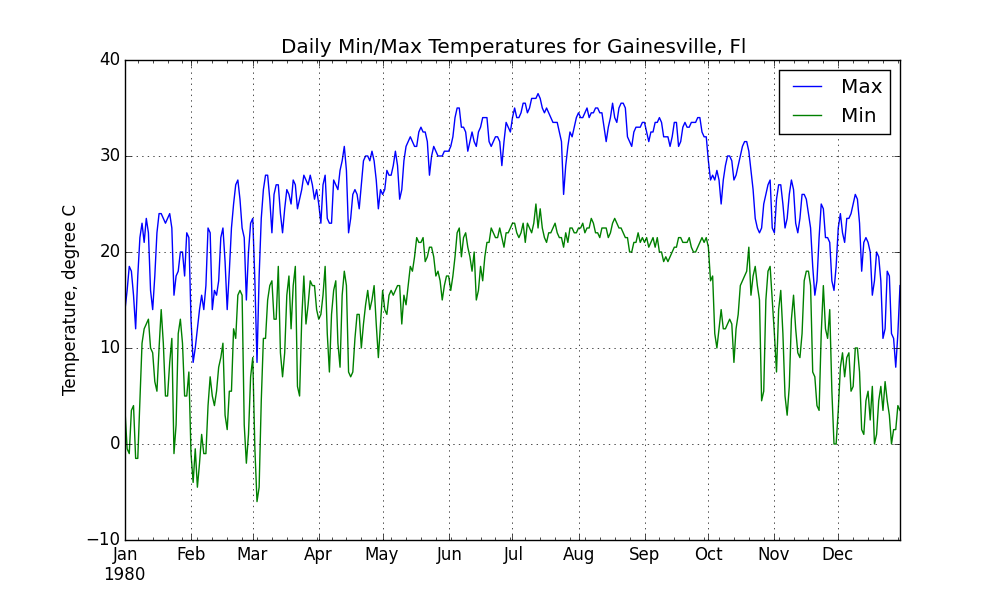
EXAMPLE: Using tstoolbox to pick out and plot particular columns
Larger command line requests are problematic and within a shell script you can use a ‘\’ at the end of the line to continue to the next line. The following example can be passed to the command line using a shell script text file to produce the following .png file:
tsgettoolbox daymet 29.652 -82.325 --year 1980 | \
    tstoolbox plot \
        --columns Daymet-tmax_\(deg_c\),Daymet-tmin_\(deg_c\) \
        --title 'Daily Min/Max Temperatures for Gainesville, Fl' \
        --xtitle ' ' \
        --ytitle 'Temperature, degree C' \
        --legend_names 'Max,Min' \
        --ofilename gainesville_min_max_temperatures.png