Filling
Fill forward
[1]:
import pandas as pd
import tstoolbox.tstoolbox as ts
from tstoolbox.toolbox_utils.src.toolbox_utils import tsutils
[2]:
dr = pd.date_range(periods=16, start="2010-01-01", freq=tsutils.pandas_offset_by_version("h"))
df = pd.DataFrame([1.1, 2.3, 2.1] + 10 * [None] + [5.4, 6.5, 7.2], dr)
[3]:
df
[3]:
| 0 | |
|---|---|
| 2010-01-01 00:00:00 | 1.1 |
| 2010-01-01 01:00:00 | 2.3 |
| 2010-01-01 02:00:00 | 2.1 |
| 2010-01-01 03:00:00 | NaN |
| 2010-01-01 04:00:00 | NaN |
| 2010-01-01 05:00:00 | NaN |
| 2010-01-01 06:00:00 | NaN |
| 2010-01-01 07:00:00 | NaN |
| 2010-01-01 08:00:00 | NaN |
| 2010-01-01 09:00:00 | NaN |
| 2010-01-01 10:00:00 | NaN |
| 2010-01-01 11:00:00 | NaN |
| 2010-01-01 12:00:00 | NaN |
| 2010-01-01 13:00:00 | 5.4 |
| 2010-01-01 14:00:00 | 6.5 |
| 2010-01-01 15:00:00 | 7.2 |
[4]:
ts.plot(input_ts=df, ofilename="base.png", style="r-*")
[4]:
<module 'matplotlib.pyplot' from '/var/home/timcera/miniconda3/envs/default314/lib/python3.14/site-packages/matplotlib/pyplot.py'>
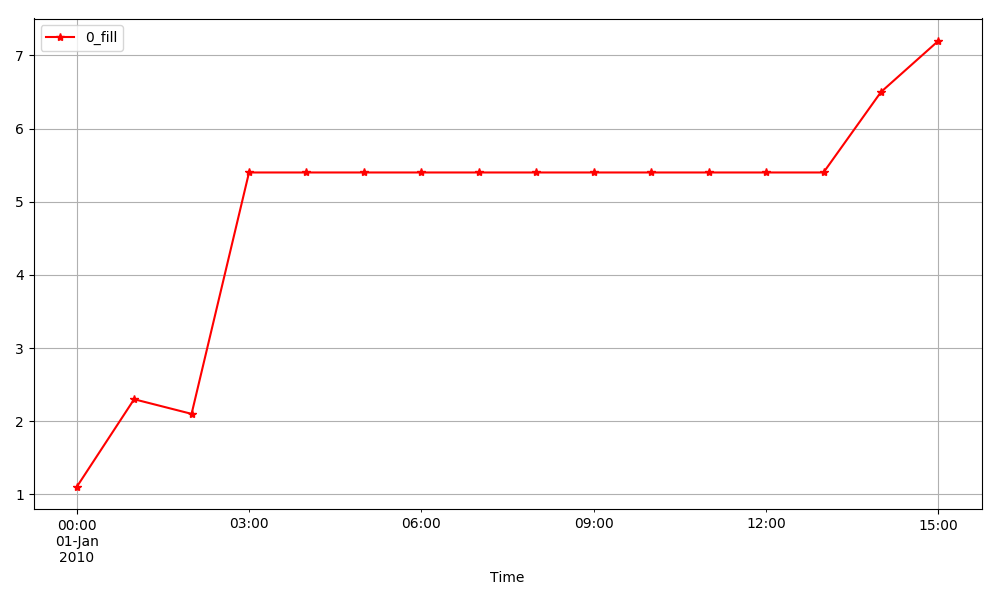
[5]:
ndf = ts.fill(input_ts=df)
ndf
[5]:
| 0::fill | |
|---|---|
| Datetime | |
| 2010-01-01 00:00:00 | 1.1 |
| 2010-01-01 01:00:00 | 2.3 |
| 2010-01-01 02:00:00 | 2.1 |
| 2010-01-01 03:00:00 | 2.1 |
| 2010-01-01 04:00:00 | 2.1 |
| 2010-01-01 05:00:00 | 2.1 |
| 2010-01-01 06:00:00 | 2.1 |
| 2010-01-01 07:00:00 | 2.1 |
| 2010-01-01 08:00:00 | 2.1 |
| 2010-01-01 09:00:00 | 2.1 |
| 2010-01-01 10:00:00 | 2.1 |
| 2010-01-01 11:00:00 | 2.1 |
| 2010-01-01 12:00:00 | 2.1 |
| 2010-01-01 13:00:00 | 5.4 |
| 2010-01-01 14:00:00 | 6.5 |
| 2010-01-01 15:00:00 | 7.2 |
[6]:
ts.plot(input_ts=ndf, ofilename="ffill.png", style="r-*")
[6]:
<module 'matplotlib.pyplot' from '/var/home/timcera/miniconda3/envs/default314/lib/python3.14/site-packages/matplotlib/pyplot.py'>
[7]:
ndf = ts.fill(input_ts=df, method="bfill")
[8]:
ts.plot(input_ts=ndf, ofilename="bfill.png", style="r-*")
[8]:
<module 'matplotlib.pyplot' from '/var/home/timcera/miniconda3/envs/default314/lib/python3.14/site-packages/matplotlib/pyplot.py'>
[ ]: